Unlocking business potential with LinkedIn datasets
In today’s digitally connected world, LinkedIn is more than a professional networking platform—it’s a powerful source of business intelligence.
In today’s rapidly evolving digital landscape, powerful and flexible user interfaces are the backbone of compelling data-driven applications. SSA Group has once again raised the bar with the latest enhancements to SSA UI kit. In this update, we introduce three exciting new components that help developers build more interactive dashboards: Gauge Chart, TreeMap Chart, and Form Builder. Let’s dive into how each of these components can transform your projects.
The Gauge Chart is a striking and intuitive data visualization tool that displays a single metric within a defined domain—much like a speedometer. By using color gradients to represent thresholds (for example, low to high), the Gauge Chart conveys performance metrics in a way that is both engaging and instantly understandable.
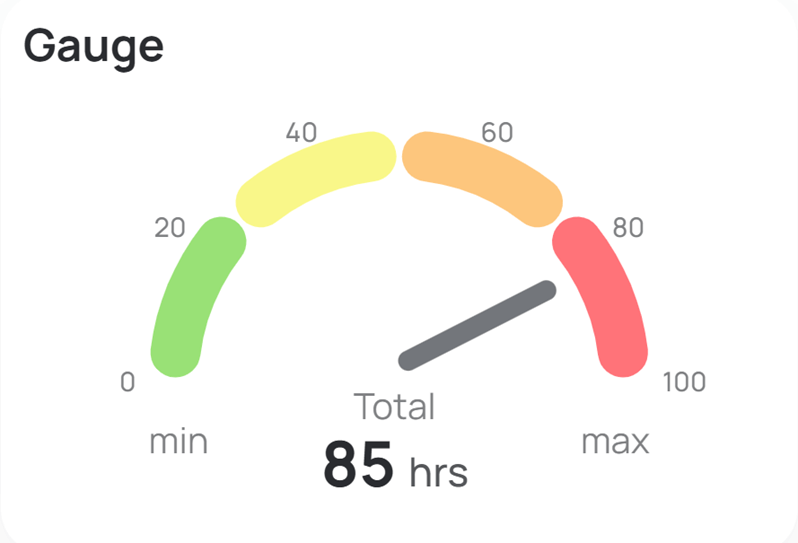
Some highlights of Gauge Chart include:
This component is ideal for monitoring KPIs such as sales progress, system performance, or user engagement—any situation where a single value needs to be highlighted without overwhelming the user with additional details.
Sometimes the true story in your data is revealed through its structure and proportional relationships. The TreeMap Chart transforms complex hierarchies into visually engaging nested rectangles, allowing you to quickly understand how individual components contribute to the whole.
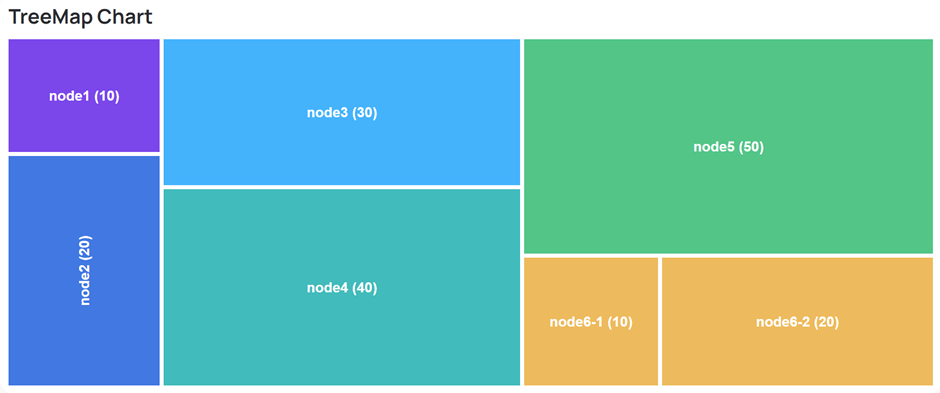
Building on its intuitive design, the TreeMap Chart offers a range of powerful features that make it an indispensable tool for data analysis. Below are some of the key benefits:
This advanced visualization tool is ideally suited for financial reporting, stock market analysis, and resource allocation dashboards—any scenario where deciphering data hierarchies is crucial for making informed decisions.
By offering an immediate and intuitive representation of complex data structures, the TreeMap Chart equips decision-makers with the clarity needed to perform in-depth analysis quickly.
Previously, creating dynamic, interactive forms required extensive manual coding. The new Form Builder component within SSA UI kit transforms this process with its intuitive drag-and-drop interface, enabling developers to quickly create, customize, and deploy configuration management files, forms, surveys, and even complex filter forms.
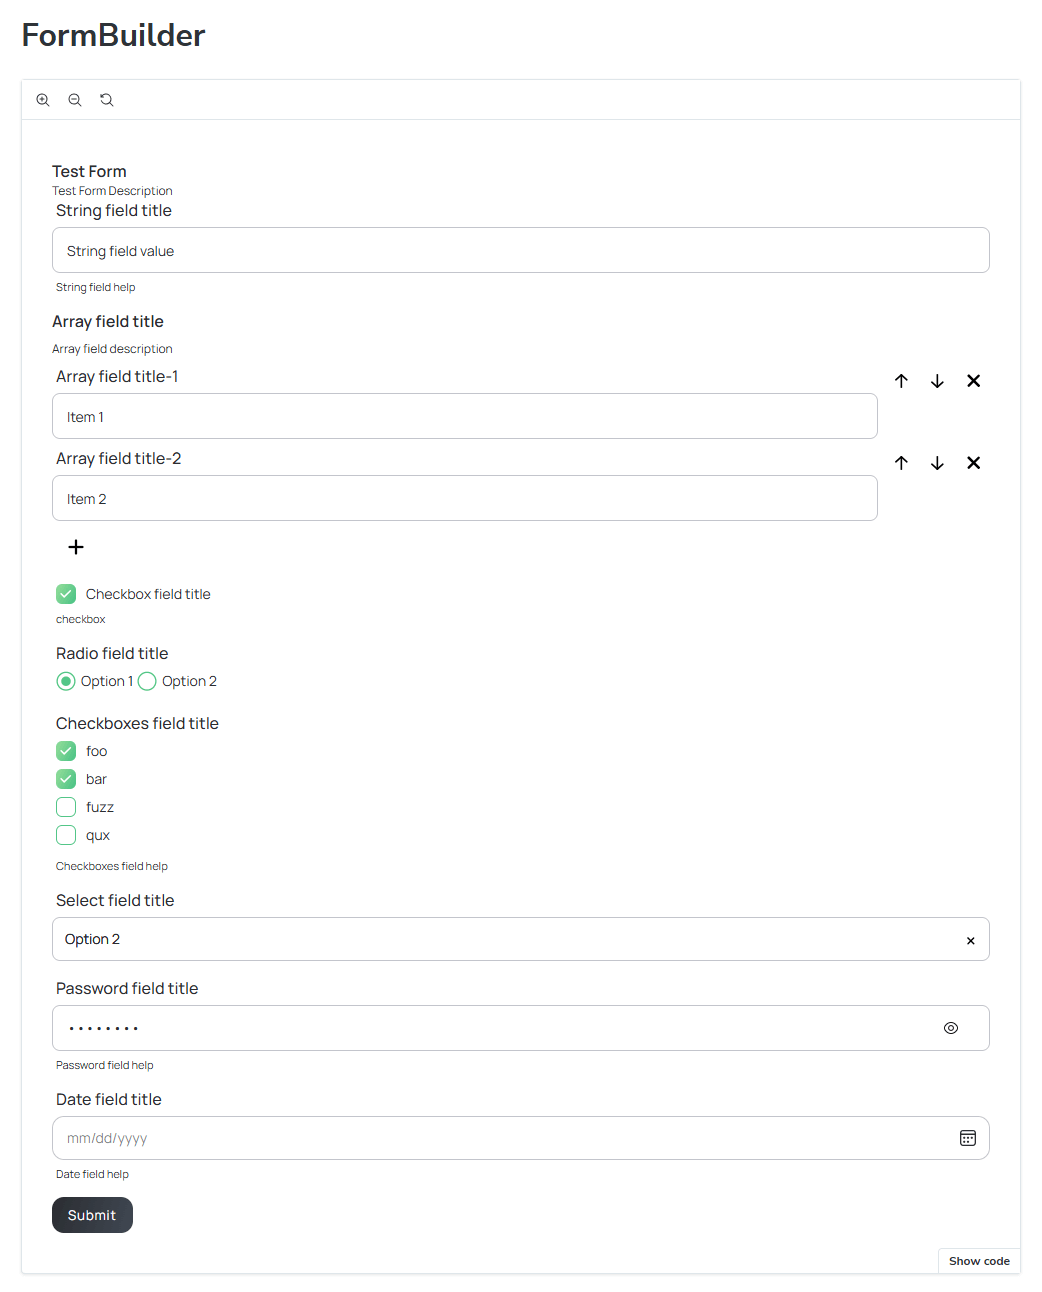
The Form Builder offers powerful features that streamline and enhance the form development process:
This tool is a game-changer for teams needing reliable, customizable forms without sacrificing development speed or user experience.
The latest components in SSA UI kit not only expand your toolbox but also streamline the process of creating visually engaging, functional dashboards. The Gauge Chart delivers an at-a-glance performance snapshot, the TreeMap Chart transforms complex hierarchical data into an accessible visual format, and the Form Builder revolutionizes form creation with an easy-to-use interface. Discover more about the latest enhancements and join SSA UI kit community on GitHub.
Ready to unlock your business’s full potential with a custom dashboard built using SSA UI kit? Let us transform your data into a dynamic, bespoke solution that drives growth and success. Leave a comment below or fill out the contact form on our website to get started!

In today’s digitally connected world, LinkedIn is more than a professional networking platform—it’s a powerful source of business intelligence.

Today, the benefits of outsourcing in the IT industry are undeniable, offering so much more than a simple reduction in software development costs.
you're currently offline